The 2022 MA Home Insurance Report Part II | MA FAIR Plan Review
FAIR Plan Participation Decreased Substantially From 2019 to 2020
This is the second part of a four-part look at the Commissioner’s Annual Report on Home Insurance in Massachusetts. Since 1996, the DOI has been required to produce a home insurance report pursuant to M.G.L. c. 175 Sec. 4A & 4B. Unlike the private passenger auto insurance marketplace in Massachusetts, however, there are no specific laws requiring that a property owner have home insurance. Please note all of the charts and graphs discussed in our articles comes courtesy of the Annual Home Insurance Report published by the Massachusetts Division of Insurance.
What is the FAIR Plan and what does it do in Massachusetts?
The FAIR Plan is a residual market mechanism that was created by Massachusetts law in the Acts1968 c. 731. Substantially restructured in 1976, and then again in 1996, it is now known as the Massachusetts Property Insurance and Underwriting Association (“MPIUA”).
Under its rules of promulgation, the FAIR Plan offers coverage for those homes which cannot obtain coverage from a traditional homeowner’s insurance company. If unable to obtain coverage in the marketplace, homeowners may apply to the Massachusetts Property and Underwriting Association which is required by statute to provide a homeowner’s policy with a replacement cost of up to $1 million dollars. For traditionally waterfront properties that may have a value of more than 1 million dollars, a homeowner must seek coverage via the surplus lines market.
FAIR Plan Participation Decreased Substantially From 2019 to 2020
The Fair Plan saw a sharp decrease in participation from 2019 to 2020, with approximately 10,177 fewer policies issued during the time period from 2019 to 2020. In comparison in the last Home Insurance report, FAIR Plan policies decreased by just 906 policies.
As a result, the FAIR Plan represented just 9.4% of all written premium in Massachusetts for 2020. At its peak participation levels in 2007, the FAIR Plan represented 16.1% of a written premium.
The rise and fall of FAIR Plan Policies over the past decade
The following graph, using data from the DOI Report, represents the number of FAIR Plan Policies during the Fiscal Years 2007-2020 (meaning from October 1st of the previous year to September 30th of the noted year). As can be seen from the graph below, 2020 is the year with the lowest number of policies.
Breaking it down by territory, the following chart highlights the MPIUA’s written premium for 2019 in each sector, along with its corresponding market share vis-à-vis the voluntary market written premium numbers for the same area.
FAIR Plan Homeowners Insurance Market Share by Territory
TerritoryMPIUA Written PremiumVoluntary Market Written PremiumFAIR Plan Market ShareBoston District A10,949,31918,455,86937.2%Boston District B273,02910,362,7682.6%Boston District C6,071,2704,997,41854.9%Suffolk Remainder7,692,06128,124,42321.5%Rest of Boston11,180,16583,647,44911.8%Brookline317,09025,145,0711.2%Quincy2,585,75722,779,62710.2%Norfolk Remainder7,081,163231,566,7663.0%Fall River4,420,69016,921,39320.7%New Bedford9,047,34215,240,91337.2%Bristol Remainder9,018,700153,261,2715.6%Brockton5,071,94624,069,35117.4%Plymouth Remainder22,331,217202,059,16110.0%Barnstable,Dukes,Nantucket87,840,063256,865,13625.5%Lawrence4,567,1629,635,65032.2%Lynn6,264,13920,718,12623.2%Essex Remainder12,754,067244,890,3245.0%Cambridge & Somerville2,153,81839,062,9785.2%Lowell2,050,41918,769,0089.8%Newton699,71043,320,1581.6%Middlesex Remainder10,661,432431,281,2662.4%Worcester City3,954,78940,001,4739.0%Worcester Remainder8,318,016222,646,9613.6%Springfield2,976,20931,750,5908.6%Chicopee & Holyoke1,429,45319,352,7236.9%Hampshire & Hampden Rem4,165,579113,627,7283.5%Franklin & Berkshire4,165,57980,314,1455.7%
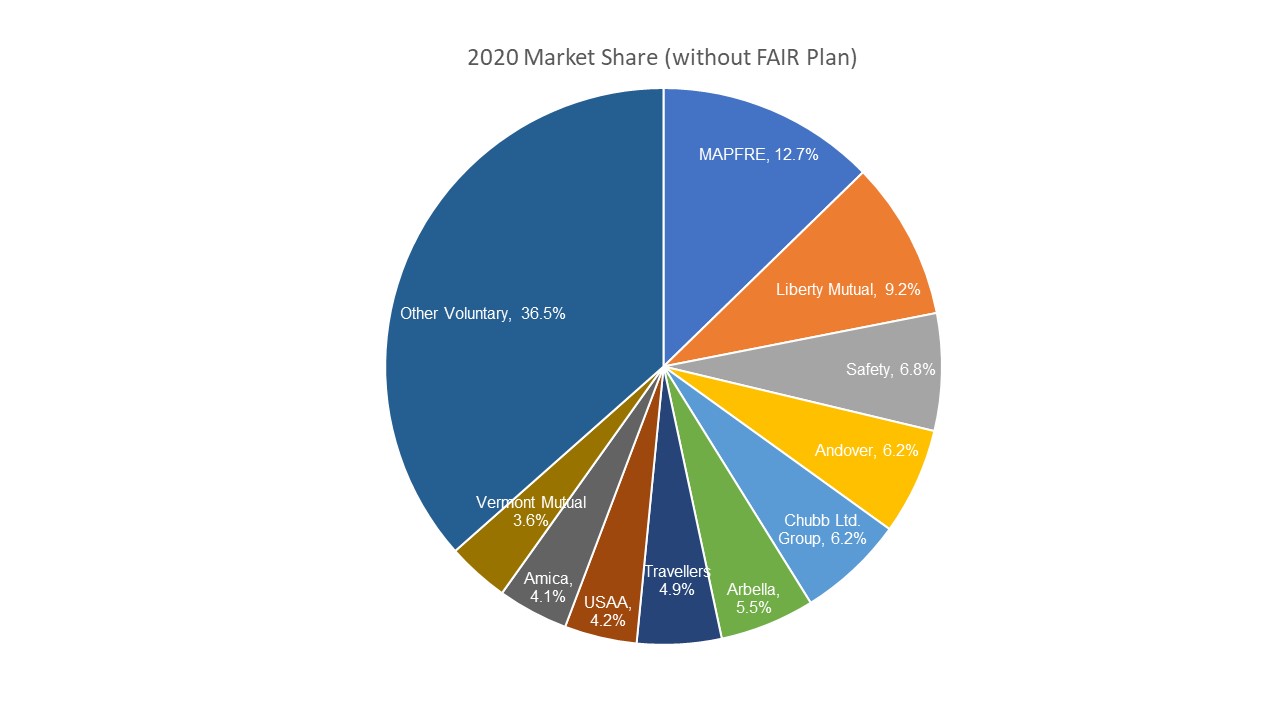
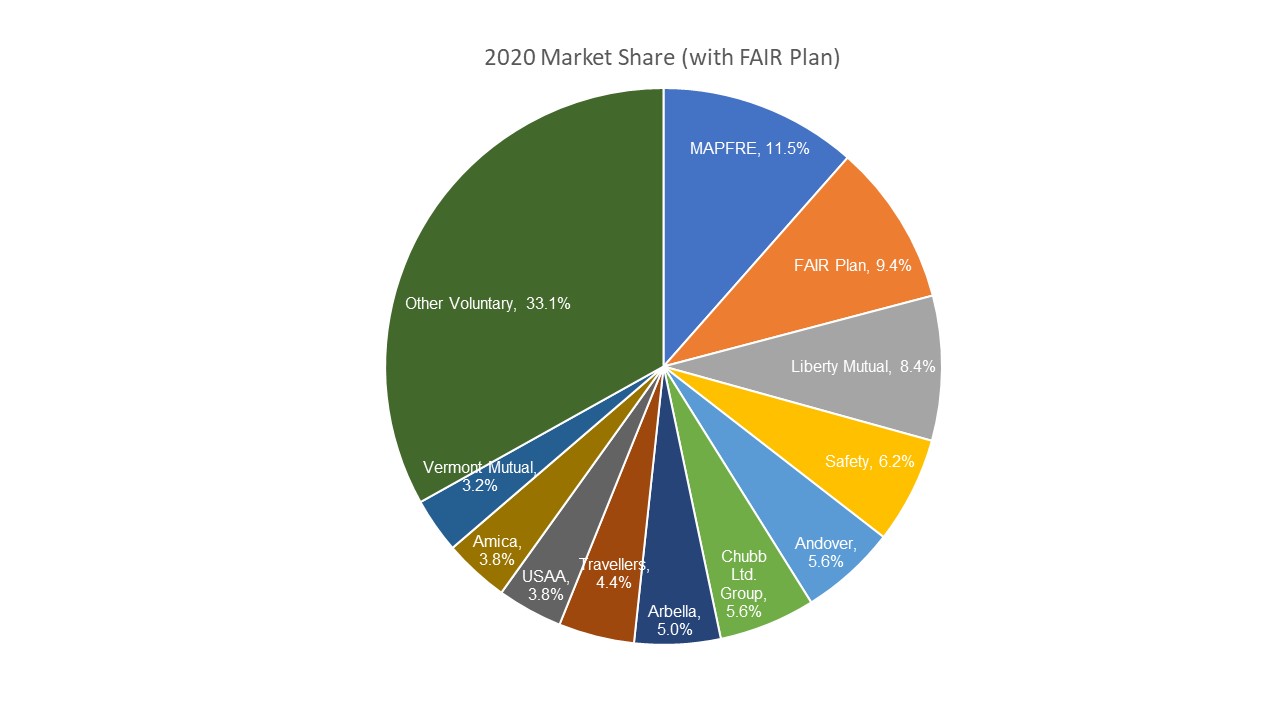
How the FAIR Plan fits within the Massachusetts homeowners insurance marketplace
MAPFRE continues to be the largest homeowner insurer in Massachusetts with 12.7% of all home insurance written premium, an increase from last year’s Home Insurance Report. Following MAPFRE, the rest of the top ten insurers averaged between 3.6% and 9.2% of the voluntary market. In total, the top 25 home insurers account for 91.7% of the market.
As noted in the DOI Report, unlike other states, the homeowners’ insurance marketplace is mainly dominated by regional carriers with only Amica, Travelers, USAA, Liberty and Chubb selling homeowners’ insurance nationally (outside of New England). Of those, however, it is interesting to note that Chubb and USAA are the only two not based out of New England.
 Data courtesy of DOI. Charts by Agency Checklists
FAIR Plan Financial Results
For fiscal year 2020, the FAIR Plan had an underwriting profit of $44,020,000. This is a huge increased from 2019 when it reported an underwriting profit of $12,288,000. this year’s numbers more closely resemble those of 2017 when the FAIR Plan reported underwriting profits of $45,041,000. The Division notes that the FAIR Plan’s underwriting results are on a direct basis and do not reflect reinsurance premiums paid by the FAIR Plan or reinsurance recoveries.
On a per policy basis, the FAIR Plan reported that its 2020 fiscal year underwriting profit, also known as “the charge against surplus” was $254 per policy. This is another increased as compared to 2019, when the underwriting profit was $67 per policy. The following chart tracks the FAIR Plan’s Underwriting gains and losses per policy over the past decade (2009-2019):
The following chart using DOI data represents the FAIR Plan’s Underwriting Gains & Losses overall for the same time period:
FAIR Plan Home Insurance Rates Retrospective
The year 2013 was the last year in which the FAIR Plan submitted an overall state-wide rate increase of 6.8%. In 2014, the Commissioner denied the rate increase, stating that the FAIR Plan had failed to meet its burden of support in demonstrating that its rate increase satisfied the statutory requirements. The last time that a rate increase was approved was in 2005 when the FAIR Plan was granted a 12.42% state-wide increase in rates, along with a 25.0% increase in Barnstable, Dukes, and Nantucket.
The following chart is a ten-year retrospective the Division created representing FAIR Plan Home Insurance Rate Changes.
FAIR Plan Home Insurance Rate Change
EFFECTIVE DATEPERCENT12/31/19965.3%12/31/19972.2%12/31/19980.9%12/31/19990.1%12/31/2000-0.5%12/31/2001-0.2%12/31/20021.9%12/31/20032.8%12/31/20043.2%10/01/200612.4%03/31/2010-0.7%
The FAIR Plan Clearinghouse
In order to address the issue of how many homes insured by the MA FAIR Plan could potentially qualify for voluntary market coverage from a licensed Massachusetts insurer, the Division noted that in July 2018, the MPIUA Board of Directors “…authorized and implemented the clearinghouse initiative to help insurance companies work with homeowners’ producers to give more residual market (i.e., FAIR Plan) policyholders the opportunity to find coverage in the voluntary market.” The aim of the initiative is to continue the depopulation of the Massachusetts FAIR Plan.
According to the report, in order to participate in the Clearinghouse, an insurer must comply with the following:
Be an admitted carrier,Be licensed to write homeowners insurance in Massachusetts, andMust sign a Clearinghouse Agreement containing the terms and conditions under which the MPIUA will provide information the company.
The DOI notes that while the information provided to companies does not include any personally identifiable information it does include “…certain information about the insured and about the property to assist the member company in determining whether to offer homeowners insurance, through the policy’s listed producer, to an existing FAIR Plan policyholder.” The Division, however, did not report any activity with respect to the FAIR Plan Clearinghouse for the fiscal year 2020 which is the subject of this year’s report.
More to come on the Annual Home Insurance Report in the coming weeks
Next week, Agency Checklists will take a look at the number of home insurance policies by county followed by further articles on the impact of auto insurance and flood insurance on this market as well as financial results from the report.
How to access the entire Homeowners Insurance Report Series: