U.S. Mortality Surge Hit People Ages 35-44 Hardest in 2021: CDC

Working-Age People
For people in four age groups who could be classified as being of working age — the 25-34, 35-44, 45-54 and 55-64 age groups — the total number of 2021 deaths was 901,421.
That was up from 11% from the 2020 working-age death total, and up 33% from the 2019 total.
The United States has about 170 million residents ages 25 through 64. The 2021 mortality figures mean that people ages 25 through 64 had roughly a 1 in 189 chance of dying from any cause that year, up from a 1 in 254 chance of dying from any cause in 2019.
Causes
The age-adjusted COVID-19 death rate increased to 104.1 per 100,000 people in 2021, from 85 in 2020, and none in 2019.
COVID-19 ranked third as a cause of death in 2021, behind cancer and heart disease, but ahead of unintentional injuries and stroke.
The age-adjusted death rate for heart disease, for example, increased to 173.8 per 100,000 people, from 168.2 in 2020 and 161.5 in 2019. The increase in heart disease and cancer death rates could be due to factors unrelated to the COVID-19 pandemic.
COVID-19, as well as efforts to prevent and treat COVID-19, may have had an indirect effect on figures for deaths attributed to other causes by making other conditions worse; causing what appear to be unrelated conditions, such as strokes; hurting the economy; increasing people’s social isolation; and reducing people’s ability to get care for conditions other than COVID-19.
U.S. Death Rates, by Age Group
Deaths per 100,000 people in AGE GROUP
Change
..
.. 2019
..2020
..2021
..From 2020
..From 2019
..1–4 ....
..23.3..
..22.7..
..25.0..
..10.1%..
..7.3%..
..5–14 ....
..13.4..
..13.7..
..14.3..
..4.4%..
..6.7%..
..15–24....
..69.7..
..84.2..
..88.9..
..5.6%..
..27.5%..
..25–34....
..128.8..
..159.5..
..180.8..
..13.4%..
..40.4%..
..35–44....
..199.2..
..248..
..287.9..
..16.1%..
..44.5%..
..45–54....
..392.4..
..473.5..
..531.0..
..12.1%..
..35.3%..
..55–64....
..883.3..
..1038.9..
..1,117.1..
..7.5%..
..26.5%..
..65–74....
..1,764.60..
..2072.3..
..2,151.3..
..3.8%..
..21.9%..
..75–84....
..4,308.30..
..4997..
..5,119.4..
..2.4%..
..18.8%..
..85 and over ....
..13,228.60..
..15210.9..
..15,743.3..
..3.5%..
..19.0%..
Source: The CDC’s Mortality in the United States, 2021 and Mortality in the United States, 2019 reports...
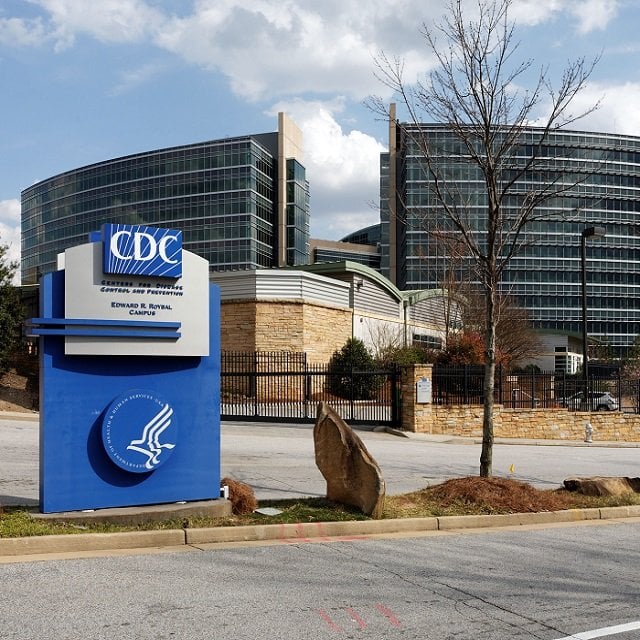
The U.S. Centers for Disease Control and Prevention headquarters in Atlanta. (Photo: Katherine Welles/Shutterstock)


