How Would Indexed Universal Life Perform During Another Lost Decade?
The Street.com reported early last week that the Bank of America price to normalized earnings ratio indicates a negative 10-year return for the S&P500. This is the first time the metric has made such an indication since 1999, and we all know how that played out.
Does this mean the S&P 500 is doomed for the next 10 years? Maybe. No one really knows. And as time goes on, some of these old metrics have a way of being wrong. That said, it brings up a bunch of reminders about investing/saving/wealth accumulation pointers we’ve made in the past, and it also served as a motivator for a great thought experiment for products like IUL during the “lost decade.”
So looking at results from 2001 through 2010–some might argue that it should be 2000 through 2009, and my reasons for not choosing that time frame is arbitrary–it was simply easier given the dataset that I had in front of me–we evaluated the real year-over-year rate of return on a $25,000 per year premium/investment during this timeframe.
When I say real, I mean real. This analysis uses IUL figures that include all of the fees associated with the product. There are no additional adjustments one would need to arrive at the real numbers achieved after opening one of these policies.
We’re looking at this to determine if indexed universal life insurance performs better, worse, or about the same as the overall stock market during the decade that many in the investment industry would rather forget. This might provide some guidance on various hedging strategies one could employ if we truly are headed down the road of another lost decade.
Here are the results looking at two possible indexing options–a standard cap 1-year point to point on the S&P 500 with an 8% cap rate and an uncapped option again using the S&P 500 but with a 9% spread:
Standard Cap:
Year
Age
Premium
Premium Charge
Policy fee
Per 1000
COI
TOTAL
S&P 500 Return
Cash Value
1
41
25,000
2,000
108
2,419
544
5,071
1.00%
20,128
2
42
25,000
1,250
60
2,419
591
4,320
1.00%
41,216
3
43
25,000
1,250
60
2,419
633
4,362
8.00%
66,803
4
44
25,000
1,250
60
2,419
658
4,387
8.00%
94,409
5
45
25,000
1,250
60
2,419
686
4,415
4.69%
120,387
6
46
25,000
1,250
60
1,210
714
3,234
8.00%
153,525
7
47
25,000
1,250
60
1,210
742
3,262
3.65%
181,661
8
48
25,000
1,250
60
1,210
768
3,288
1.00%
205,406
9
49
25,000
1,250
60
1,210
797
3,317
8.00%
245,256
10
50
25,000
1,250
60
1,210
826
3,346
8.00%
288,263
10 Year IRR:
3.13%
11
51
25,000
1,250
60
0
872
2,182
1.00%
314,192
12
52
25,000
1,250
60
0
919
2,229
1.00%
340,333
13
53
25,000
1,250
60
0
975
2,285
8.00%
392,092
14
54
25,000
1,250
60
0
1,041
2,351
8.00%
447,920
15
55
25,000
1,250
60
0
1,115
2,425
4.69%
492,561
16
56
25,000
1,250
60
0
1,204
2,514
8.00%
556,251
17
57
25,000
1,250
60
0
1,303
2,613
3.65%
599,758
18
58
25,000
1,250
60
0
1,417
2,727
1.00%
628,251
19
59
25,000
1,250
60
0
1,544
2,854
8.00%
702,429
20
60
25,000
1,250
60
0
1,598
2,908
8.00%
782,483
20 Year IRR:
4.48%
Uncapped:
Year
Age
Premium
Premium Charge
Policy fee
Per 1000
COI
TOTAL
S&P 500 Return
Cash Value
1
41
25,000
2,000
108
2,419
544
5,071
1.00%
20,128
2
42
25,000
1,250
60
2,419
591
4,320
1.00%
41,216
3
43
25,000
1,250
60
2,419
633
4,362
17.38%
72,605
4
44
25,000
1,250
60
2,419
658
4,387
1.00%
94,150
5
45
25,000
1,250
60
2,419
686
4,415
1.00%
115,882
6
46
25,000
1,250
60
1,210
714
3,234
2.65%
141,296
7
47
25,000
1,250
60
1,210
742
3,262
1.00%
164,664
8
48
25,000
1,250
60
1,210
768
3,288
1.00%
188,240
9
49
25,000
1,250
60
1,210
797
3,317
14.45%
240,257
10
50
25,000
1,250
60
1,210
826
3,346
3.78%
271,811
10 Year IRR:
1.84%
11
51
25,000
1,250
60
0
872
2,182
1.00%
297,575
12
52
25,000
1,250
60
0
919
2,229
1.00%
323,550
13
53
25,000
1,250
60
0
975
2,285
8.00%
373,966
14
54
25,000
1,250
60
0
1,041
2,351
8.00%
428,344
15
55
25,000
1,250
60
0
1,115
2,425
4.69%
472,067
16
56
25,000
1,250
60
0
1,204
2,514
8.00%
534,118
17
57
25,000
1,250
60
0
1,303
2,613
3.65%
576,817
18
58
25,000
1,250
60
0
1,417
2,727
1.00%
605,081
19
59
25,000
1,250
60
0
1,544
2,854
8.00%
677,405
20
60
25,000
1,250
60
0
1,598
2,908
8.00%
755,457
20 Year IRR:
4.14%
The second set of 10 years looks at how IUL performs under the same return circumstances, but as the policy ages and fees go down. I realize this statement may appear contradictory to what you might find written elsewhere on the internet. But look at the table above. They report the fees charged against the policies. Note that in year one the sum of fees charged on the universal life insurance policy is $5,071. Look now at the last year, year 20, where the sum of fees charged is $2,908. In fact, the average annual total of fees for the first 10 years is $3,900 while it’s only $2,509 during the second set of 10 years.
There are two points I’m seeking to review here. First, knowing that fees are lower during this next 10 year period, how does the policy perform under a scenario where the same mediocre market returns take place. Second, how would a normal investment in the stock market under an identical scenario play out? The answer to that is in our next section.
As we can see, the rate of return goes up as the policy ages. This makes sense since the fees go down and the cash value continues to grow.
But what happened to a normal investment in an index fund?
Passive Index Investing in the Lost Decade
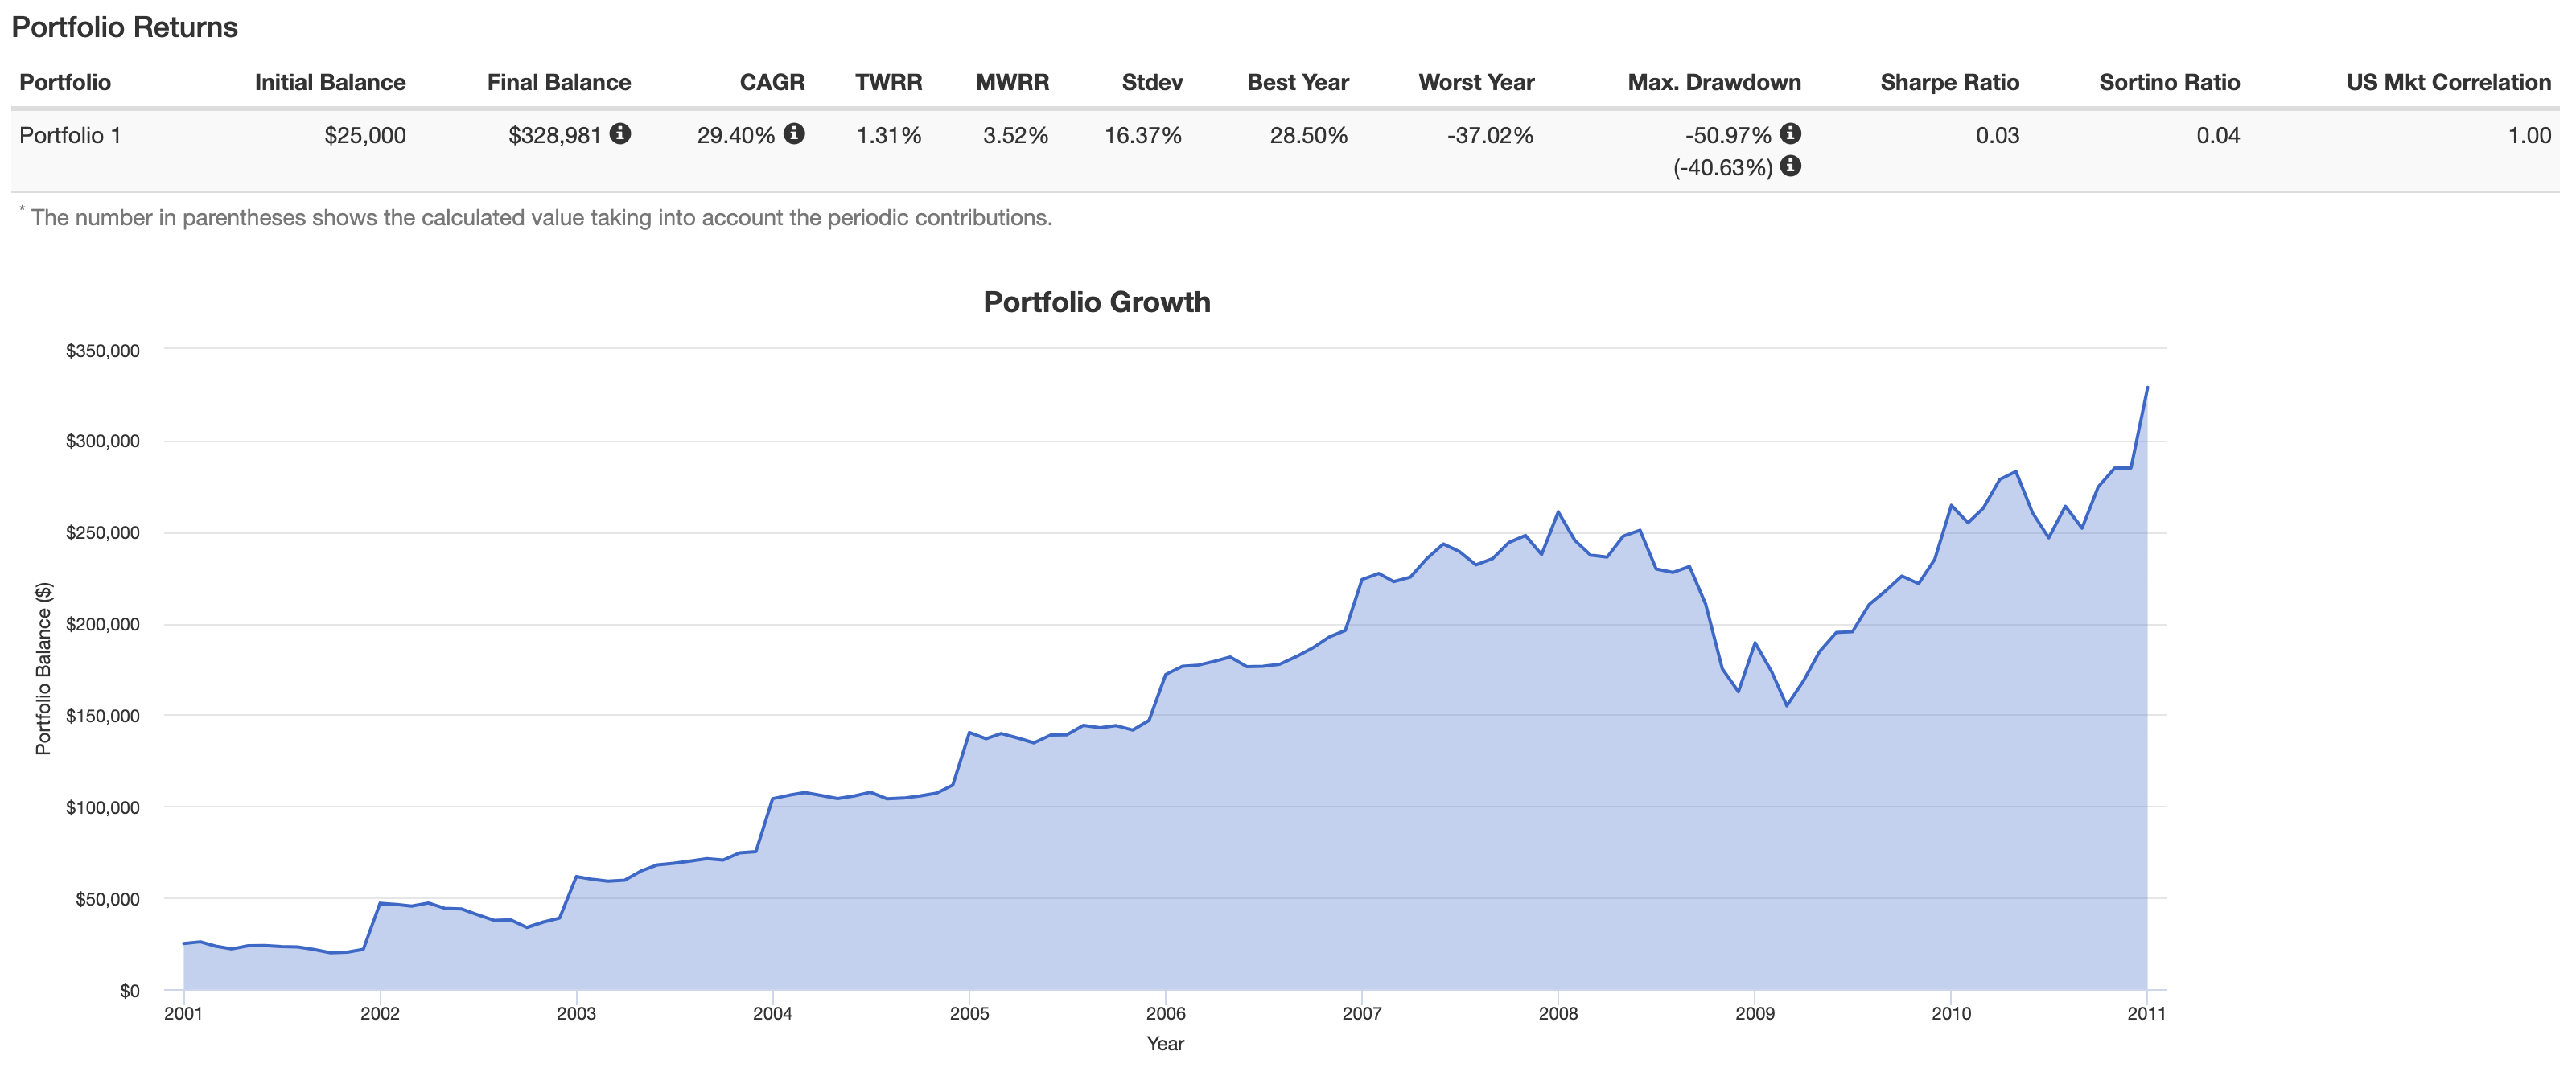
Contrary to popular belief, the lost decade wasn’t necessarily a loss for those who made regular investments in a passive strategy. Looking at this time frame with a $25,000 per year investment into the Vanguard 500 Index Fund (VFINX) here are the first 10 year results:
Source: Portfolio Visualizer
As you can see, the decade isn’t “lost” per se. This is largely the case because we used a systematic investment over the period versus a lump sum in year 1. This allows the investor to buy in at different prices and it, therefore, changes the results.
Still note the MWRR (Money-weighted Rate of Return) this is the same thing we are calculating in the tables above for the IUL policy. 3.52% as the year-over-year rate of return isn’t much better than the insurance policy, and you didn’t have the take the wild ride during the 10 years.
But check out what happens if we continue on assuming that the next 10 years will produce the same return results:
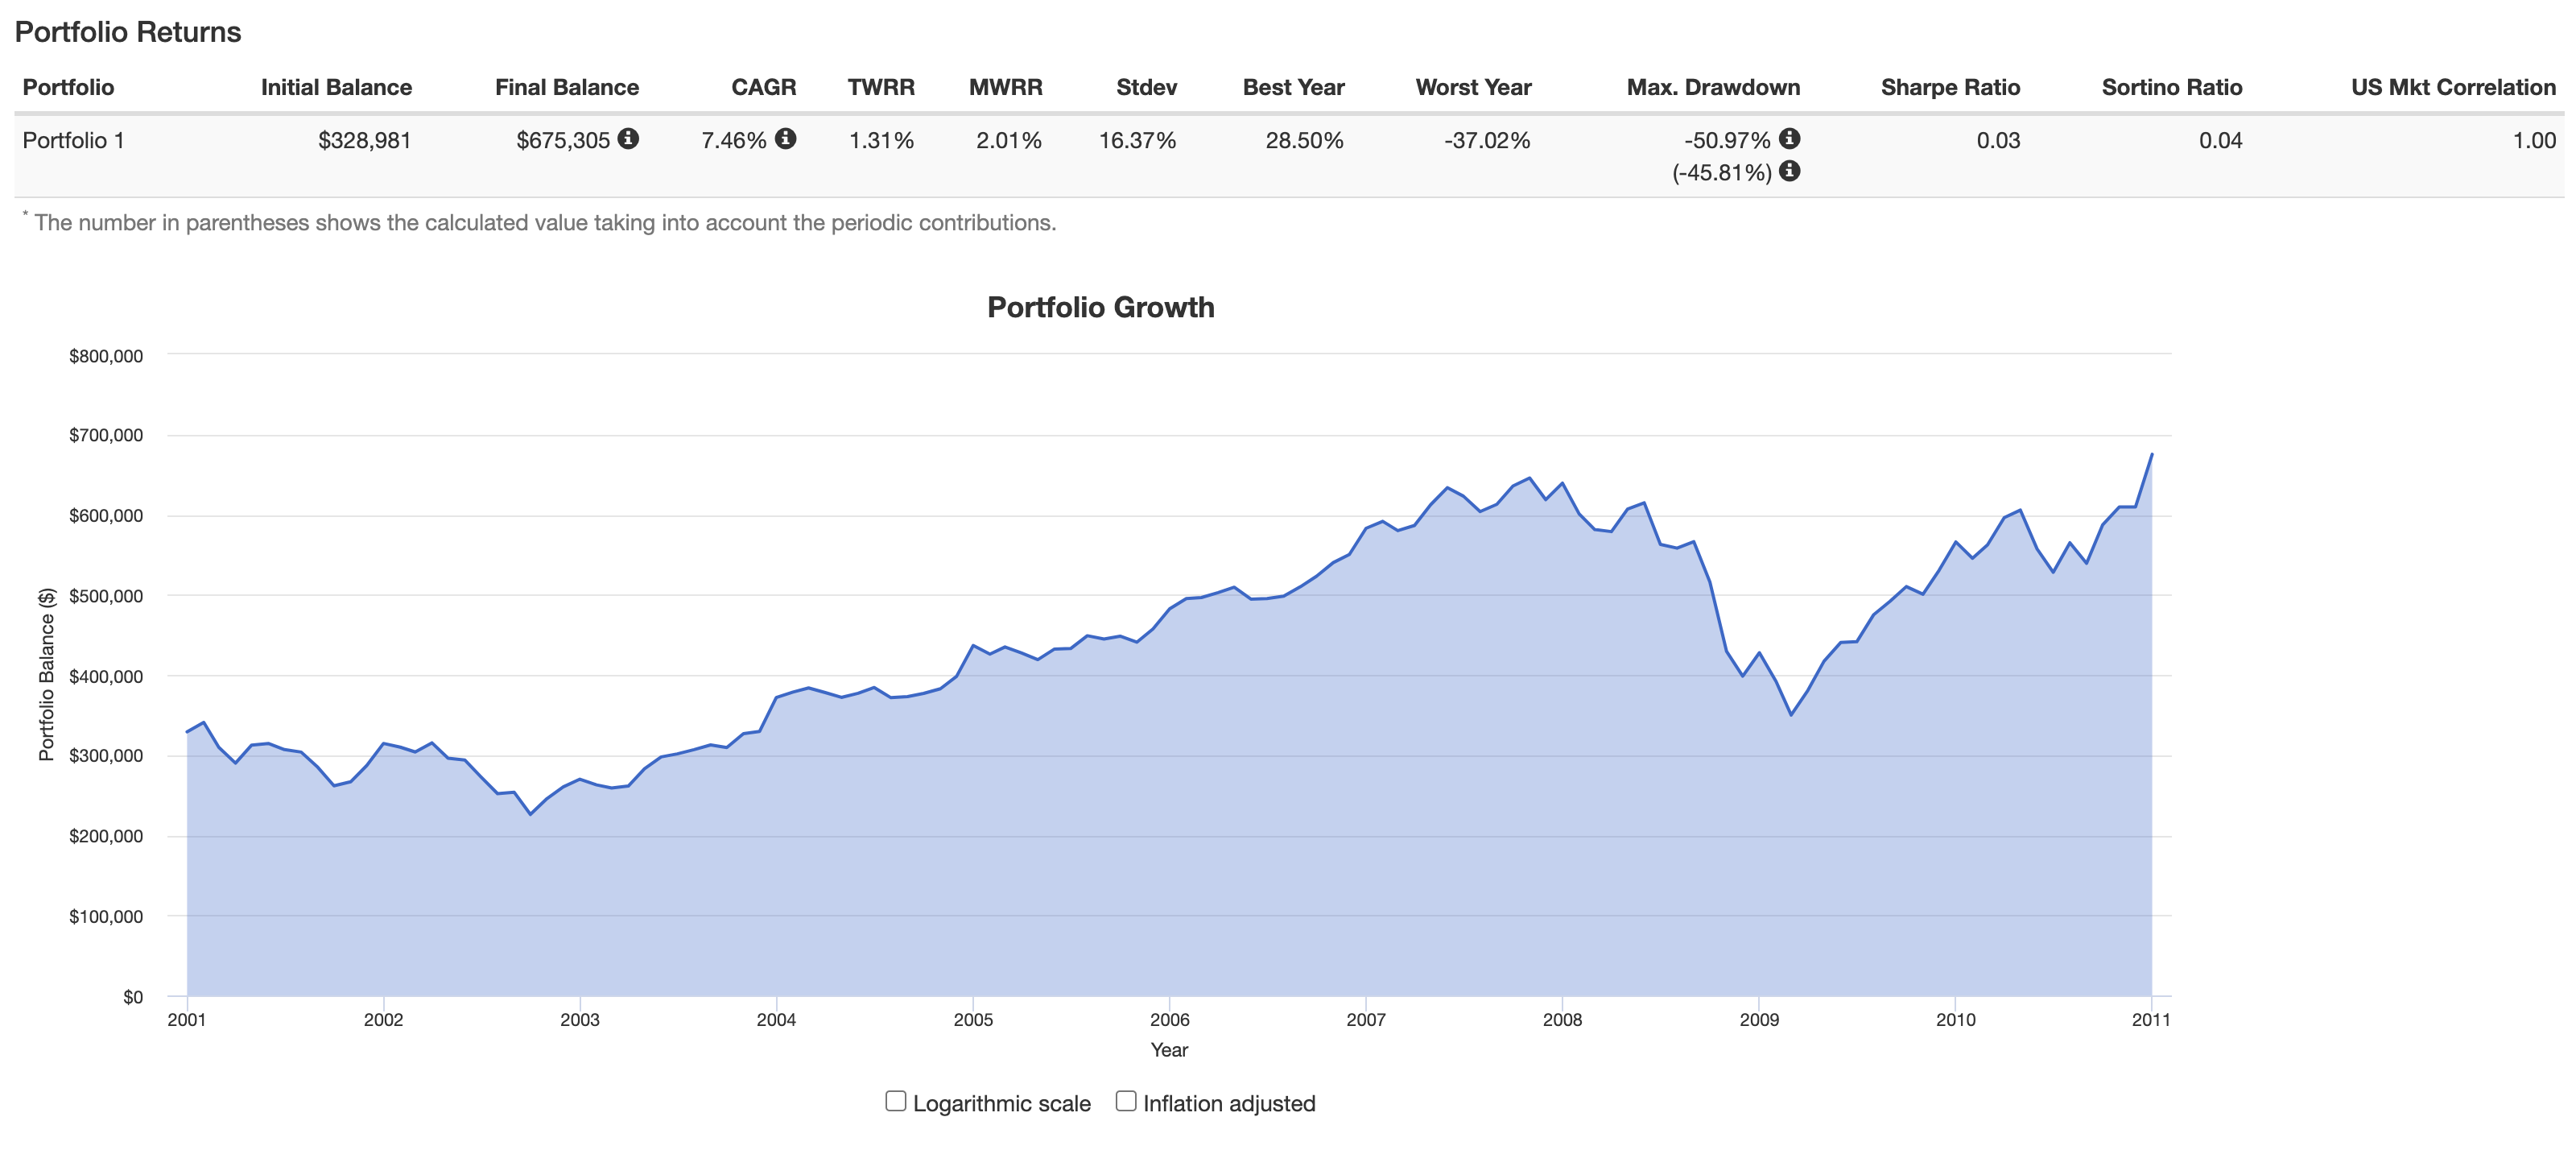 Source: Portfolio Visualizer
We can’t use the MWRR reported from the portfolio visualizer because it’s assuming this is only a 10 year period. We have to instead calculate it based on a 20 year period. When we do this, the real result is 3.05%.
Now, there’s an interesting question many will likely have. Why would the rate of return go down if the returns are exactly the same? This is an understandable area of eyebrow-raising. The answer is because time and the timing of returns matter.
This illustrates a point we’ve made a time or 10 in the past. Time does not reduce risk. It actually exposes you to more of it. This is the case because each year that ticks by opens up a new opportunity to lose money. The conventional wisdom that time is a great hedge against risk is absolutely false when we are talking about the absolute rate of return. If a long time produces an agreeable rate of return, that is a much more happy accident than it is the implementation of a solid investment plan.
Recommendations Based on This Data
The biggest takeaway is an old sentiment we’ve championed before. Indexed universal life insurance is not tied to the stock market. Owning it does not give you additional stock market exposure. Avoiding it because you already have stock market exposure is false thinking.
Time is both your friend and your enemy. It’s great in the sense that it can compound returns to produce ever more wealth. But it comes with drawbacks–namely that it comes with increased exposure to losses from a market correction.
Once you understand this subtle, but important implication to stock market investments and the role life insurance could play in your retirement portfolio strategy, you likely become a lot friendlier to the idea of owning cash value life insurance.
This isn’t to say one wins and the other loses. Even if we strongly believe that during the next decade the stock market will end below where it started, there is still plenty of good reason to own stocks as part of a retirement portfolio building strategy. When the two product categories are used in conjunction with one another, good things happen.
Some Additional Facts to Ponder
The investment scenarios ignore fees and taxes. So the real results may be less
The UL figures do not ignore fees–taxes would be inapplicable.
The UL product used for this pays a bonus that was not factored into the cash value results and therefore would have produced even more cash therefore a higher rate of return in real life.
The UL growth is close to linear meaning no choppy gains and losses. This might have saved some people from themselves selling when they freaked out and causing even worse results than the already terrible returns the VFINX investment produced in this study period.
What about whole life insurance? We’d expect very similar results to the universal life results here as that product doesn’t vary under market fluctuations.