Markets Are Worried About the Debt Ceiling. These Charts Show How Much.

Even with those considerations in mind, however, it should become apparent if investors look to be avoiding particular issues because of ceiling concerns rather than any difference stemming from policy or liquidity. At the moment, the curve shows various small dislocations around various points, but not one that currently shows major strain.
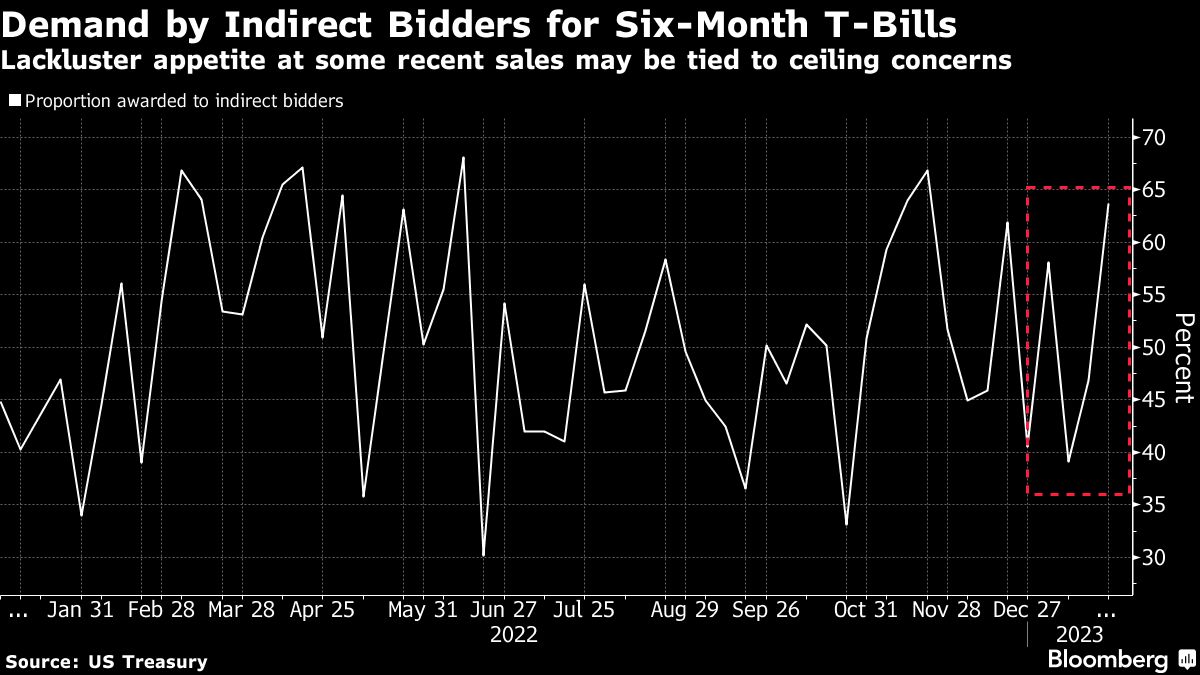
Lackluster Auctions
The unwillingness of investors to hold paper maturing around those riskier dates can also manifest itself in their behavior at regular government debt sales. Even without a major shift in pricing, it’s possible to infer concern from which types of buyer are purchasing the more at-risk maturities.
Before Yellen warned Congress about the debt cap and announced her plans for extraordinary measures, investors had shown early signs of avoiding six-month bills. Until this week, the proportion bought by so-called indirect bidders — a group that includes money-market funds — had been relatively lackluster.
That suggested, for a time, some waning of their appetite for paper due around July, although as the x-date becomes more clearly defined these investors may start shying away from other benchmark offerings instead.
A Place of Greater Safety
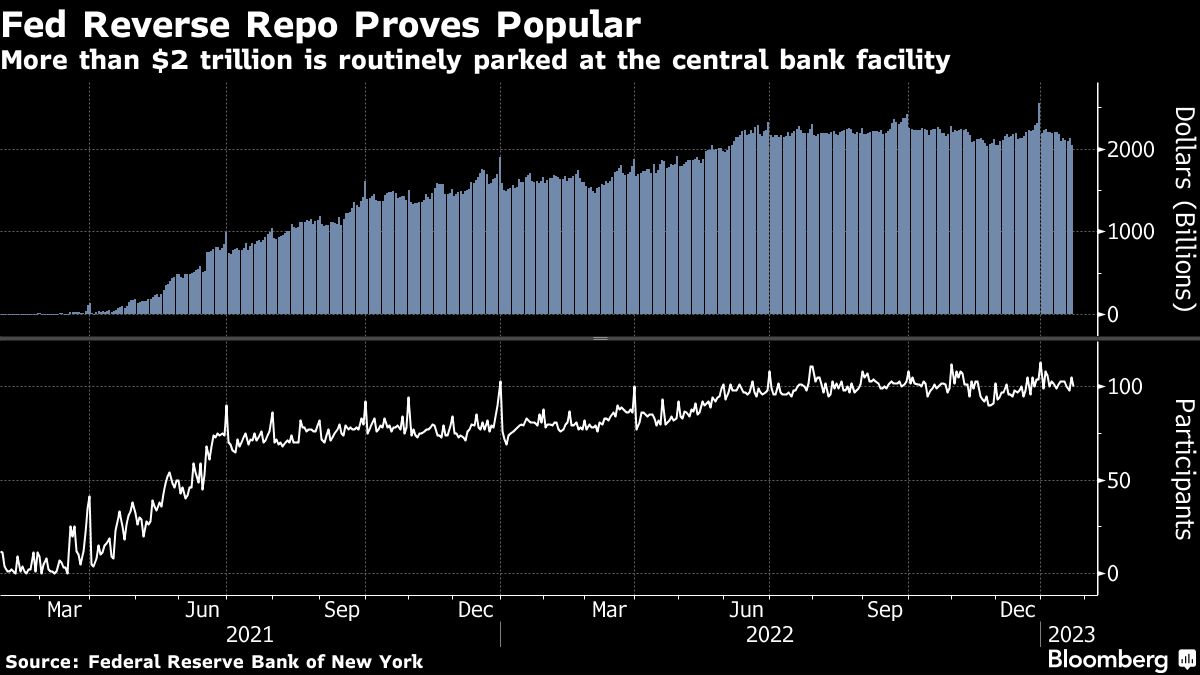
Investors still need somewhere to park their short-term cash if they’re avoiding certain T-bills, and that could help add to already blockbuster demand to place money at the Federal Reserve’s facility for reverse repurchase agreements.
Investors have placed more than $2 trillion there every day for over half a year, fueled in large part by a shortage of bills across the spectrum relative to the amount of spare cash that needs a home.
Should investors start steering away from particular bill maturities, that could boost demand to place cash there. On top of that, the likely reduction in overall bill supply that goes hand-in-glove with the approach of the debt ceiling will also likely buoy usage, meaning this is likely to be a key metric for observers to keep an eye on.
Dwindling Government Cash
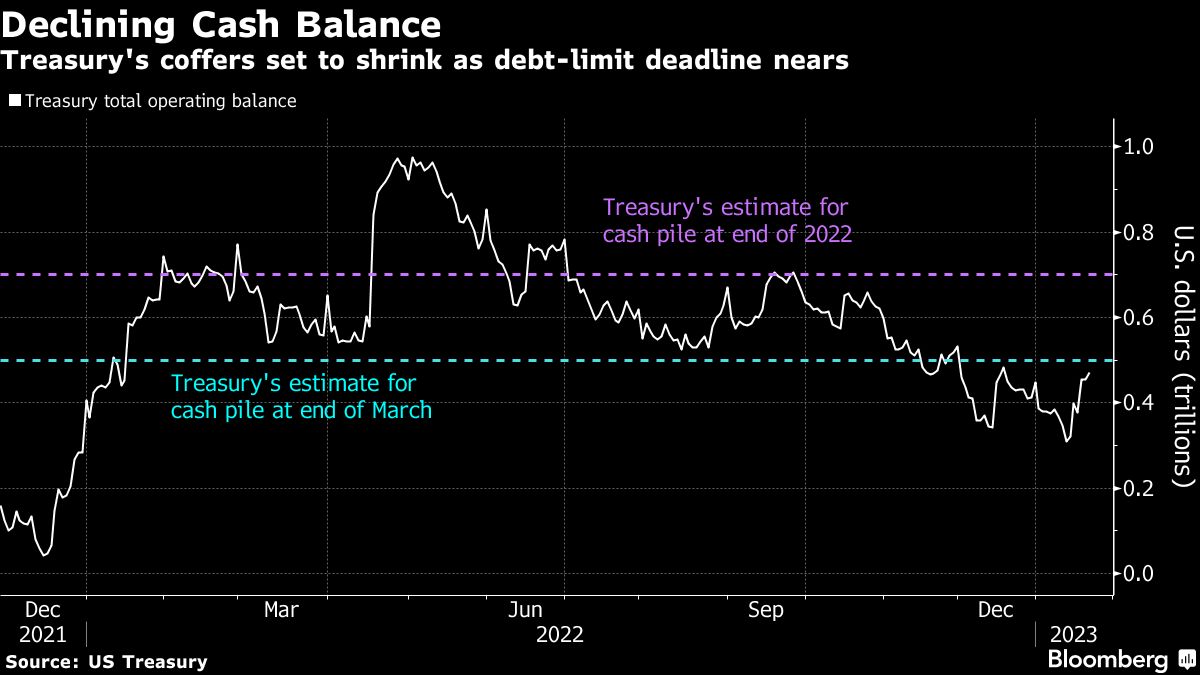
Finally, perhaps one of the most stark measures of how close America is to the edge — although not a market-based metric — is the Treasury’s cash balance, and the department’s predictions for where it will go.
The approach of the debt limit usually results in the Treasury drawing down the amount of ready cash it keeps as officials avoid borrowing excess money that the government doesn’t need right away.
That’s less than ideal from the point of view of officials, because they like to keep a decent buffer and there are risks to not having leeway if there’s a disruption in debt markets.
The department provides regular data on how much cash it has, as well as forecasts as part of its quarterly financing announcements process. The cash pile right now is around $471 billion, down from more than $600 billion at a similar time last year.
Perhaps more notably, it’s already well below the levels that the Treasury had predicted for the end of December and March at its last quarterly announcements close to three months ago. That suggests a faster outflow than they had banked on and analysts will be keenly attuned to what predictions they give at their upcoming announcements next week.
(Credit: Konstantin Hermann/Adobe Stock)


