U.S. Life Insurance Application Activity Closes the Year with Solid Growth, Reports the MIB Life Index – Woburn Daily Times
BRAINTREE, Mass., Jan. 18, 2022 /PRNewswire/ — U.S. life insurance application activity finished 2021 with annual Year-over-Year (YOY) growth up +3.4%, according to the U.S. MIB Life Index, representing the second consecutive year of growth. Following record breaking YOY growth in 2020 of +3.9%, 2021 achieved the second highest YOY annual growth rate on record. YOY comparisons are impacted by fluctuations in 2020 activity due to COVID; however, when comparing 2021 results to 2019, the industry was up +7.4%.
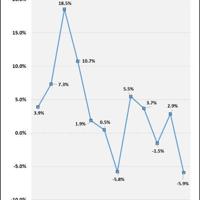
2021 started strong with growth in the first four months, including the strongest YOY growth for the months of February, March and April on record. May and June saw flat activity, followed by a decline in July. August through November experienced growth or flat activity, while December ended the year at a decline. Note, YOY declines in July and December can be attributed to record breaking high activity during those months in 2020.
Activity for all ages showed annual YOY growth for 2021, with the most growth coming from the 31-50 and 71+ age bands. Full year activity for ages 0-30 was up +2.2%, ages 31-50 up +4.5%, ages 51-60 up +3.1%, ages 61-70 up +2.3% and for ages 71+ up by +4.1%. This growth pattern is in contrast to 2020 where age 31-50 lead in YOY growth, but the 71+ age group experienced declines. Throughout the year we saw several shifts in trends by age band. However, as of April the 71+ age band began to outpace the younger set and, with the exception of September, showed the highest YOY gain across all age bands for the remainder of the year.
Growth in 2021 was driven by increases in activity across face amounts up to and including $250K and over $500K. In a continuing trend that started last year, we saw the most growth in larger face amounts. When examining age bands, annual YOY activity for ages 0-30 showed growth for face amounts up to and including $5M, in the double digits for policies over $1M up to and including $2.5M. Ages 31-50 saw annual YOY growth for amounts up to and including $250K and over $500K, in the double digits for policies over $5M. Ages 51-60 saw annual YOY growth for all amounts, in the double digits for amounts over $5M. Age 61-70 saw annual YOY growth for face amounts up to and including $250K and over $1M, in the double digits for amounts over $2.5M. Ages 71+ saw annual YOY growth for amounts up to and including $250K and over $500K up to and including $5M, in the double digits for amounts over $2.5M up to and including $5M, but double-digit declining activity for face amounts over $5M.
When examining product types, 2021 saw annual YOY growth in Universal and Whole Life of +3.0% and +8.3% respectively. Term Life annual YOY application activity was relatively flat at -0.1%. Growth patterns were consistent across age groups with growth percentages highest for Whole Life, followed by Universal Life and flat or declining for Term Life.
We also examined activity by gender and observed that annual YOY growth in application activity for males slightly outpaced that for females. When looking at trends in face amounts by gender, we saw a significant difference in activity for females vs males for policies over $1M. Females saw YOY growth in the double digits for all face amounts over $1M, with growth for amounts over $5M in excess of +35%. Males in contrast saw flat activity for policies over $5M and single digit growth for policies over $1M up to and including $5M.
For more detailed insights, read the full 2021 MIB Life Index Annual Report, available on www.mibgroup.com.
Monthly Percent Change Composite Index
(year over year)
Dec-21
-5.9%
Nov-21
2.9%
Oct-21
-1.5%
Sep-21
3.7%
Aug-21
5.5%
July-21
-5.8%
June-21
0.5%
May-21
1.9%
April-21
10.7%
March-21
18.5%
Feb-21
7.3%
Jan-21
3.9%
YTD-2021
3.4%
YTD-2020
3.9%
Q4-2021
-1.5%
Q3-2021
1.0%
Q2-2021
4.3%
Q1-2021
10.1%
Â
Â
Monthly % Change
Age Groups
(year over year)
Â
0-30
31-50
51-60
61-70
71+
Dec-21
-4.6%
-5.5%
-7.6%
-9.2%
-0.4%
Nov-21
2.5%
3.2%
1.7%
0.8%
12.0%
Oct-21
-1.6%
-0.5%
-3.2%
-5.1%
4.8%
Sep-21
1.0%
7.5%
1.8%
-1.8%
6.3%
Aug-21
0.6%
8.5%
6.0%
3.0%
9.0%
July-21
-8.5%
-5.1%
-4.8%
-5.2%
-3.3%
June-21
-3.3%
1.1%
0.8%
3.6%
4.3%
May-21
-1.3%
2.6%
1.9%
4.1%
5.2%
April-21
15.4%
6.1%
10.4%
15.0%
20.4%
March-21
18.5%
17.8%
20.4%
20.6%
13.2%
Feb-21
5.1%
11.0%
8.4%
4.3%
-6.2%
Jan-21
3.7%
8.5%
2.9%
-1.8%
-10.9%
YTD 2021
2.2%
4.5%
3.1%
2.3%
4.1%
Â
US Monthly Percent Change vs Prior Month
December
-11.7%
Methodology Change for 2021:
MIB has changed the way we report trends in application activity. Effective with our January report, variations with industry activity reflect a straight period over period percent changes (YTD, YOY, MOM, and QOQ) based on calendar days vs. the prior methodology based on a 2011 baseline index on a business day calculation.
About the MIB Life Index
The MIB Life Index is the life insurance industry’s timeliest measure of application activity in the United States. Released each month, the report is based on the number of searches MIB member company life underwriters perform on the MIB Checking ServiceSM database. Since over 95% of life insurance applications in North America include an MIB search, as a routine underwriting requirement, the MIB Life Index provides a reasonable means to estimate new business activity. For past releases, methodology or to subscribe visit www.mibgroup.com.
About MIB
MIB Group Holdings, Inc. is the insurance industry’s most trusted and secure partner for data, insights and digital solutions that support underwriting and actuarial decision making and improve industry efficiencies. With deep connections to the life insurance companies who are its members, and a sole focus on improving the insurance industry, MIB is uniquely positioned to provide data-driven solutions that address common industry challenges and enable clients to gain efficiencies, manage their risks, and grow profitably. MIB Group Holdings, Inc. provides services through its wholly owned operating subsidiaries, MIB, LLC, MIB Services, LLC and MIB Solutions, LLC. Â For more information, visit www.mibgroup.com
Media Inquiries:
Betty-Jean Lane
MIB Group, Inc.
781.751.6135
blane@mib.com
View original content to download multimedia:https://www.prnewswire.com/news-releases/us-life-insurance-application-activity-closes-the-year-with-solid-growth-reports-the-mib-life-index-301463280.html
SOURCE MIB Group Holdings, Inc.


